Is Bitcoin Prepared for New All-Time Highs? Insights from the Charts
An analyst has provided insights into various charts concerning Bitcoin, indicating whether the current upward trend might lead to a new peak.
Signs Suggest Bitcoin Momentum Might Be Slowing
In a recent update on X, analyst Ali Martinez discussed several technical indicators that may suggest whether Bitcoin is poised to achieve a new all-time high (ATH).
The analyst shared a series of charts pertinent to this analysis:
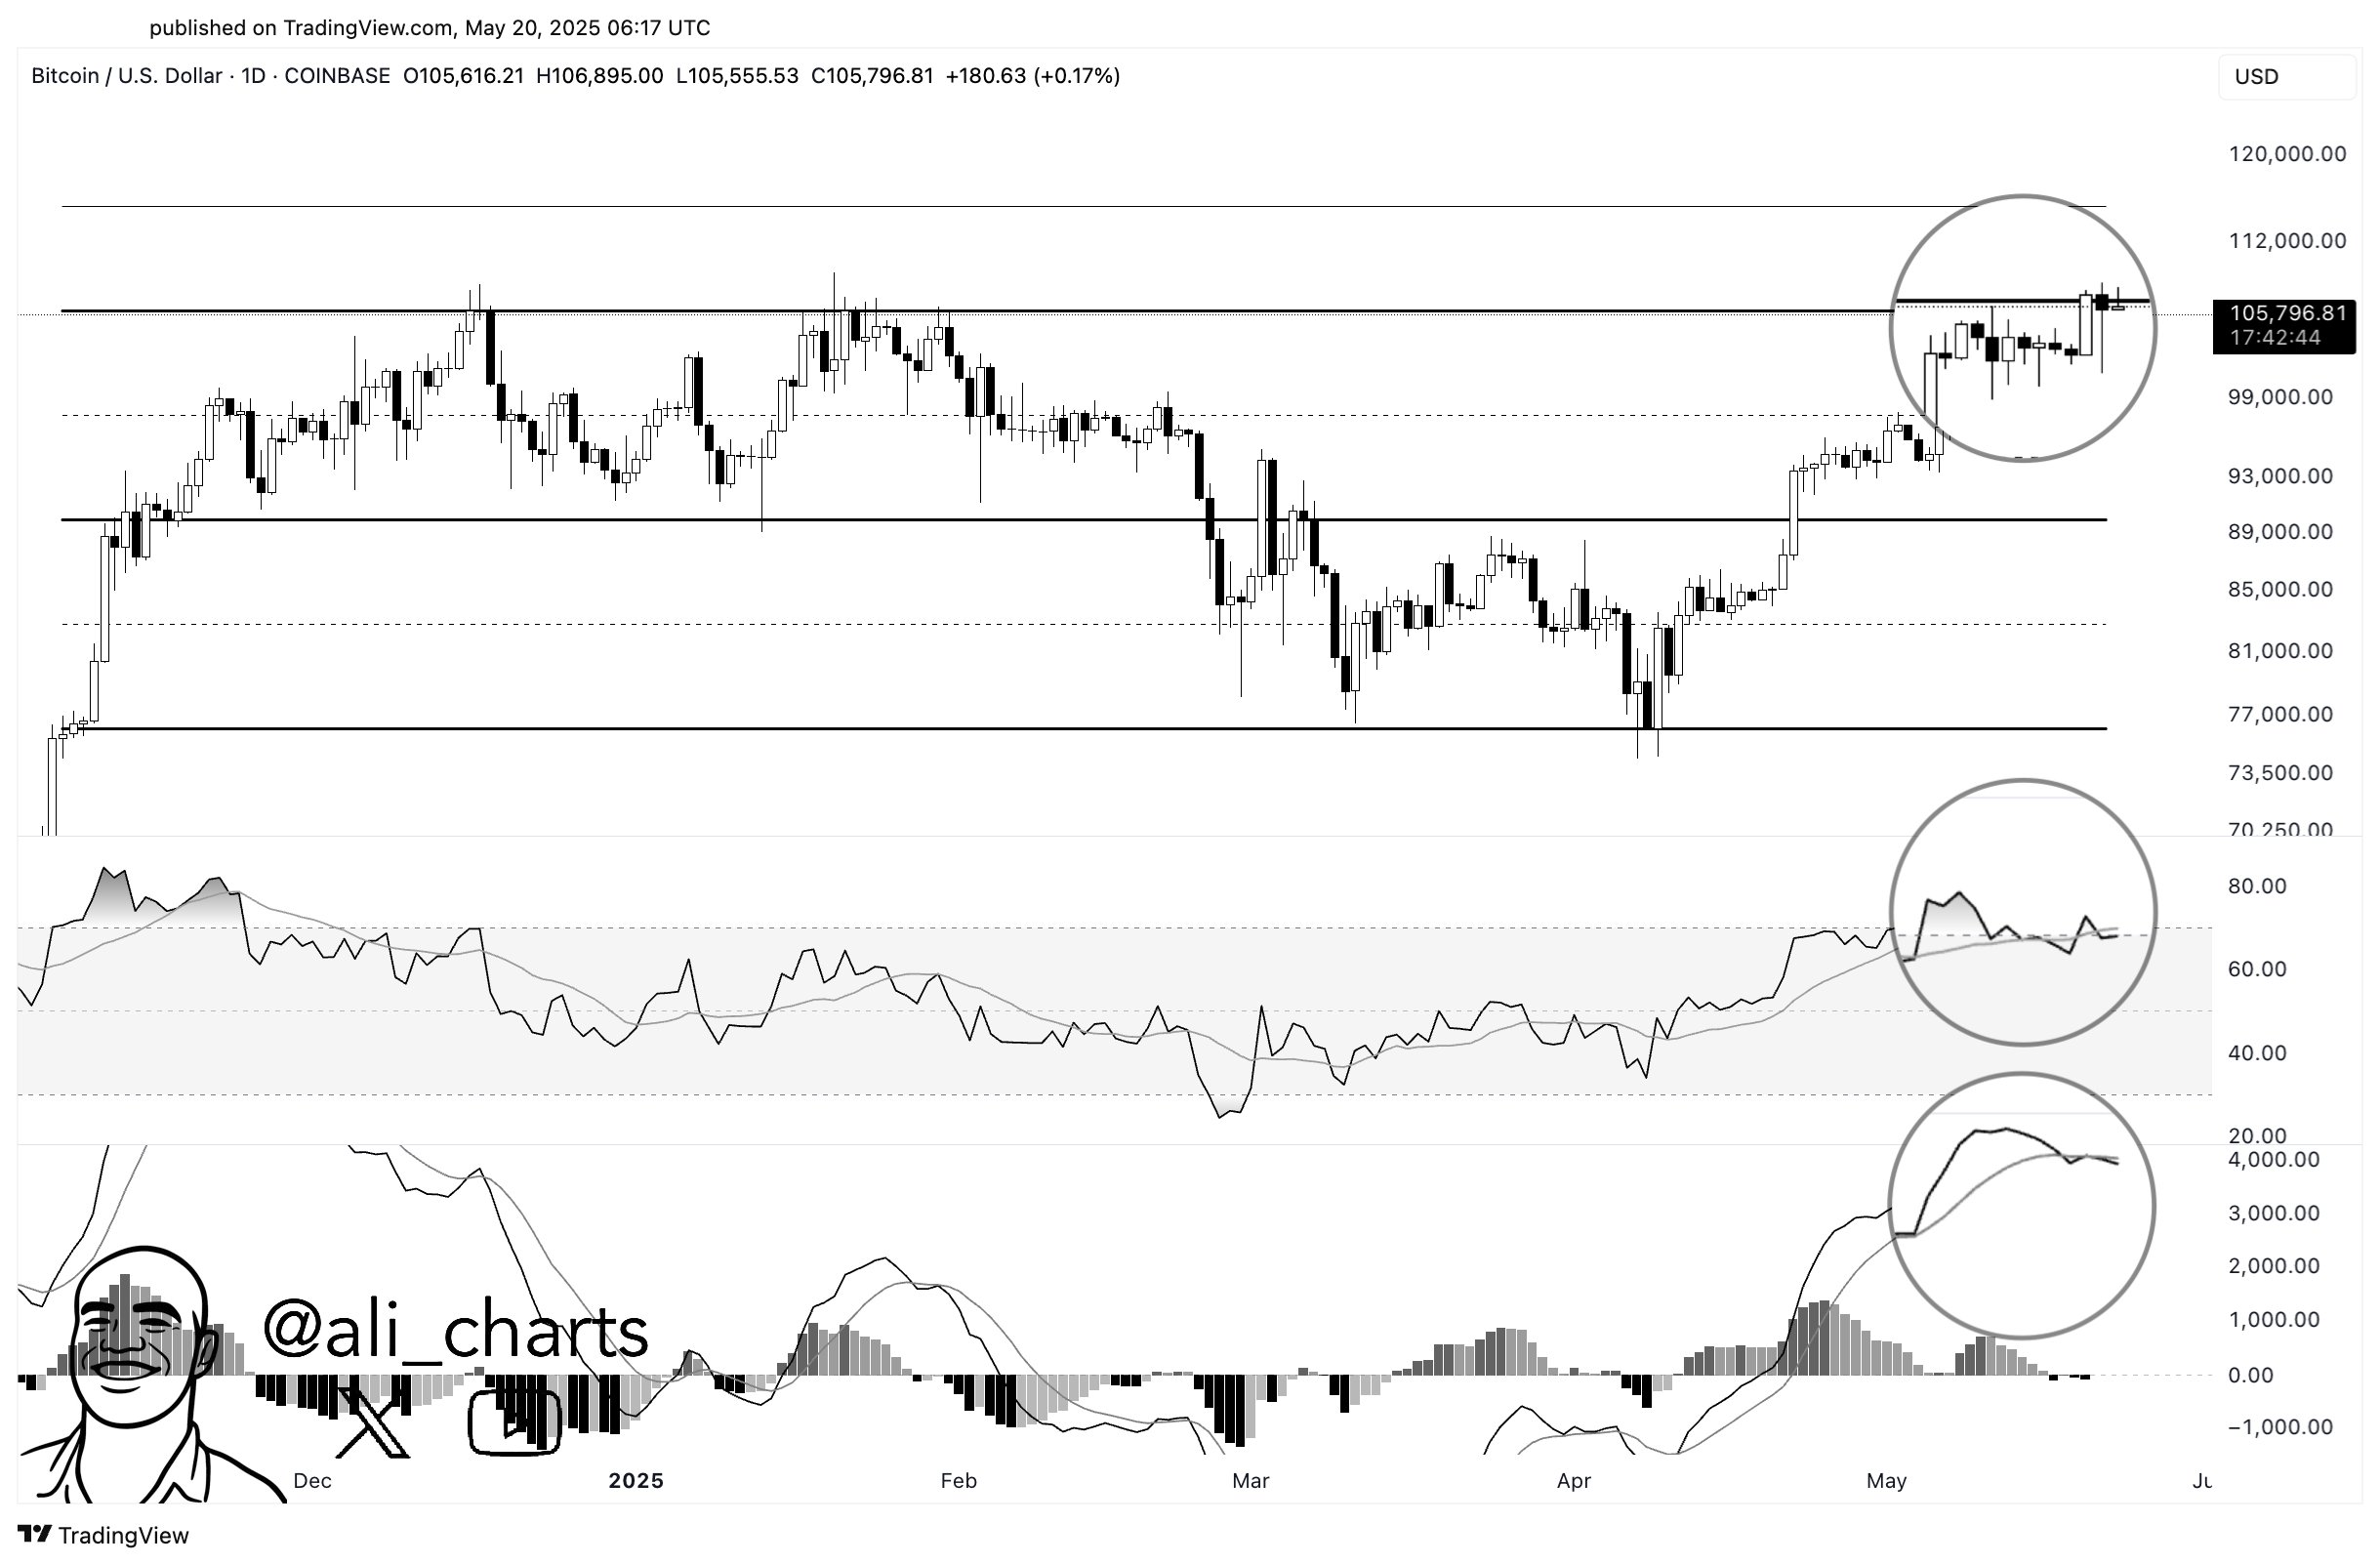
The initial chart illustrates a technical pattern that Bitcoin appears to have followed over recent months. This particular pattern is termed a “Parallel Channel,” characterized by the price movements of an asset consolidating between two parallel lines.
While there are various forms of Parallel Channels, the most relevant one in this context is the horizontal channel aligned with the time axis, indicating a predominantly sideways movement in the cryptocurrency.
The chart indicates that Bitcoin recently approached the upper boundary of this channel. In prior instances of testing this line, the cryptocurrency has experienced resistance. Therefore, it could encounter similar pushback during the current test.
Another trend complicating potential new highs is highlighted in the second chart, which shows a divergence in the RSI in relation to Bitcoin’s price movements. The Relative Strength Index (RSI) is a tool used to assess the speed and degree of recent price changes, helping to identify whether an asset is overbought or oversold.
This month, Bitcoin’s RSI reached a peak in the overbought range; however, while the price continued to rise, the RSI only formed a lower peak. Such divergence between the asset price and the RSI is often interpreted as a bearish indicator.
Additionally, a negative trend is indicated in the MACD, as shown in the third chart. The Moving Average Convergence/Divergence (MACD) is an essential tool for measuring momentum in price movements.
The MACD comprises two lines: the MACD line derives from the difference between the 12-day and 26-day exponential moving averages (EMAs), and the signal line is the 9-day EMA of the MACD line. Recently, Bitcoin’s MACD line has fallen below the signal line, which is commonly viewed as a bearish crossover.
BTC Price
After making another effort to break past the $106,000 mark sustainably, Bitcoin has retraced to approximately $105,300.


Post Comment